Observer meta-research | Terms of use screen reader | Taxonomy card sort | Experience research | Eye tracking research
Eye tracking research for online voter guides
Objective: Understand design considerations and recommend changes for online voter guides specifically regarding low-literacy voters.
My Role: A Master’s student research assistant under my advisor, the primary investigator, working alongside three other Master’s student researcher assistants on a grant funded by the California Secretary of State. My duties on this project included general organizing and planning, drafting our test script, moderating over half of the eye-tracking usability testing sessions, classifying and drafting our qualitative findings, and compiling the final report to submit to our stakeholders.
Grant-funded research
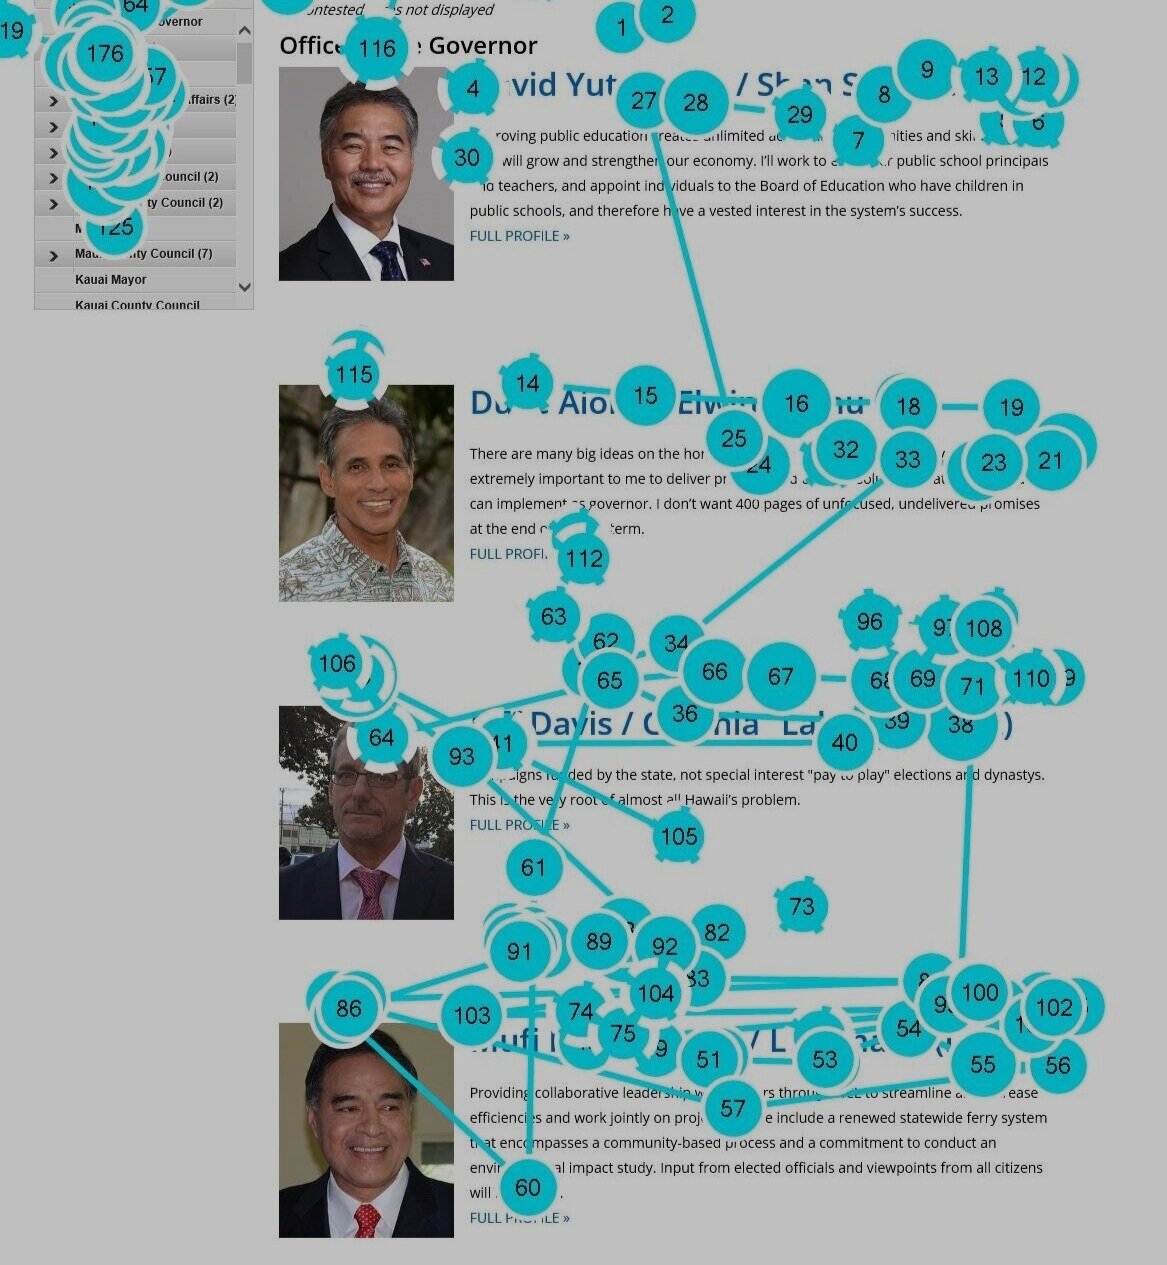
As part of my Master’s work, I took part in a grant-funded eye tracking study on how low-literacy voters navigate voter guide websites. We utilized a Tobii eye-tracker to study the usability of online voter guides with low-literacy voters.
Our objectives were defined between our primary investigator and our stakeholders as part of the grant award, including participants, testing type, which state online voter guides we’d use, and that we’d be looking at both qualitative and quantitative data.
Special considerations
This research required consideration for both eye-tracking and for low-literacy participants. Eye-tracking requires care for interference from glasses or fidgeting participants, which can cause issues with data collection.
Finding low-literacy participants meant adding an extra step in the screening process - a REALM reading test. Since low-literacy can mean reduced ability to skim long paragraphs, this often lead to longer task times, which in turn meant occasionally forgetting the task. While moderating, I found patience to be an asset.
Qualitative and quantitative analysis
After testing, I focused on coding qualitative data. We took both the quantitative eye-tracking data and combined it with the qualitative data from task observations and post-session interviews to compile a robust report of recommendations on designing for low-literacy voters.
Lasting impact
This research left a lasting impact on me as a researcher. I saw for the first time the full need of a UX researchers to be empathic to both users and research participants. I also found the importance of being patient and allowing participants the needed time to perform a task.


