Observer meta-research | Terms of use screen reader | Taxonomy card sort | Experience research | Eye tracking research
Towson University | Customer experience and service design research
Research planning, conducting research, and communicating findings are skills I regularly used in my full-time position as a Technology Project Manager at Towson University’s centralized IT division. This page describes my leadership in research that enhanced service design at several different levels.
Experience surveys
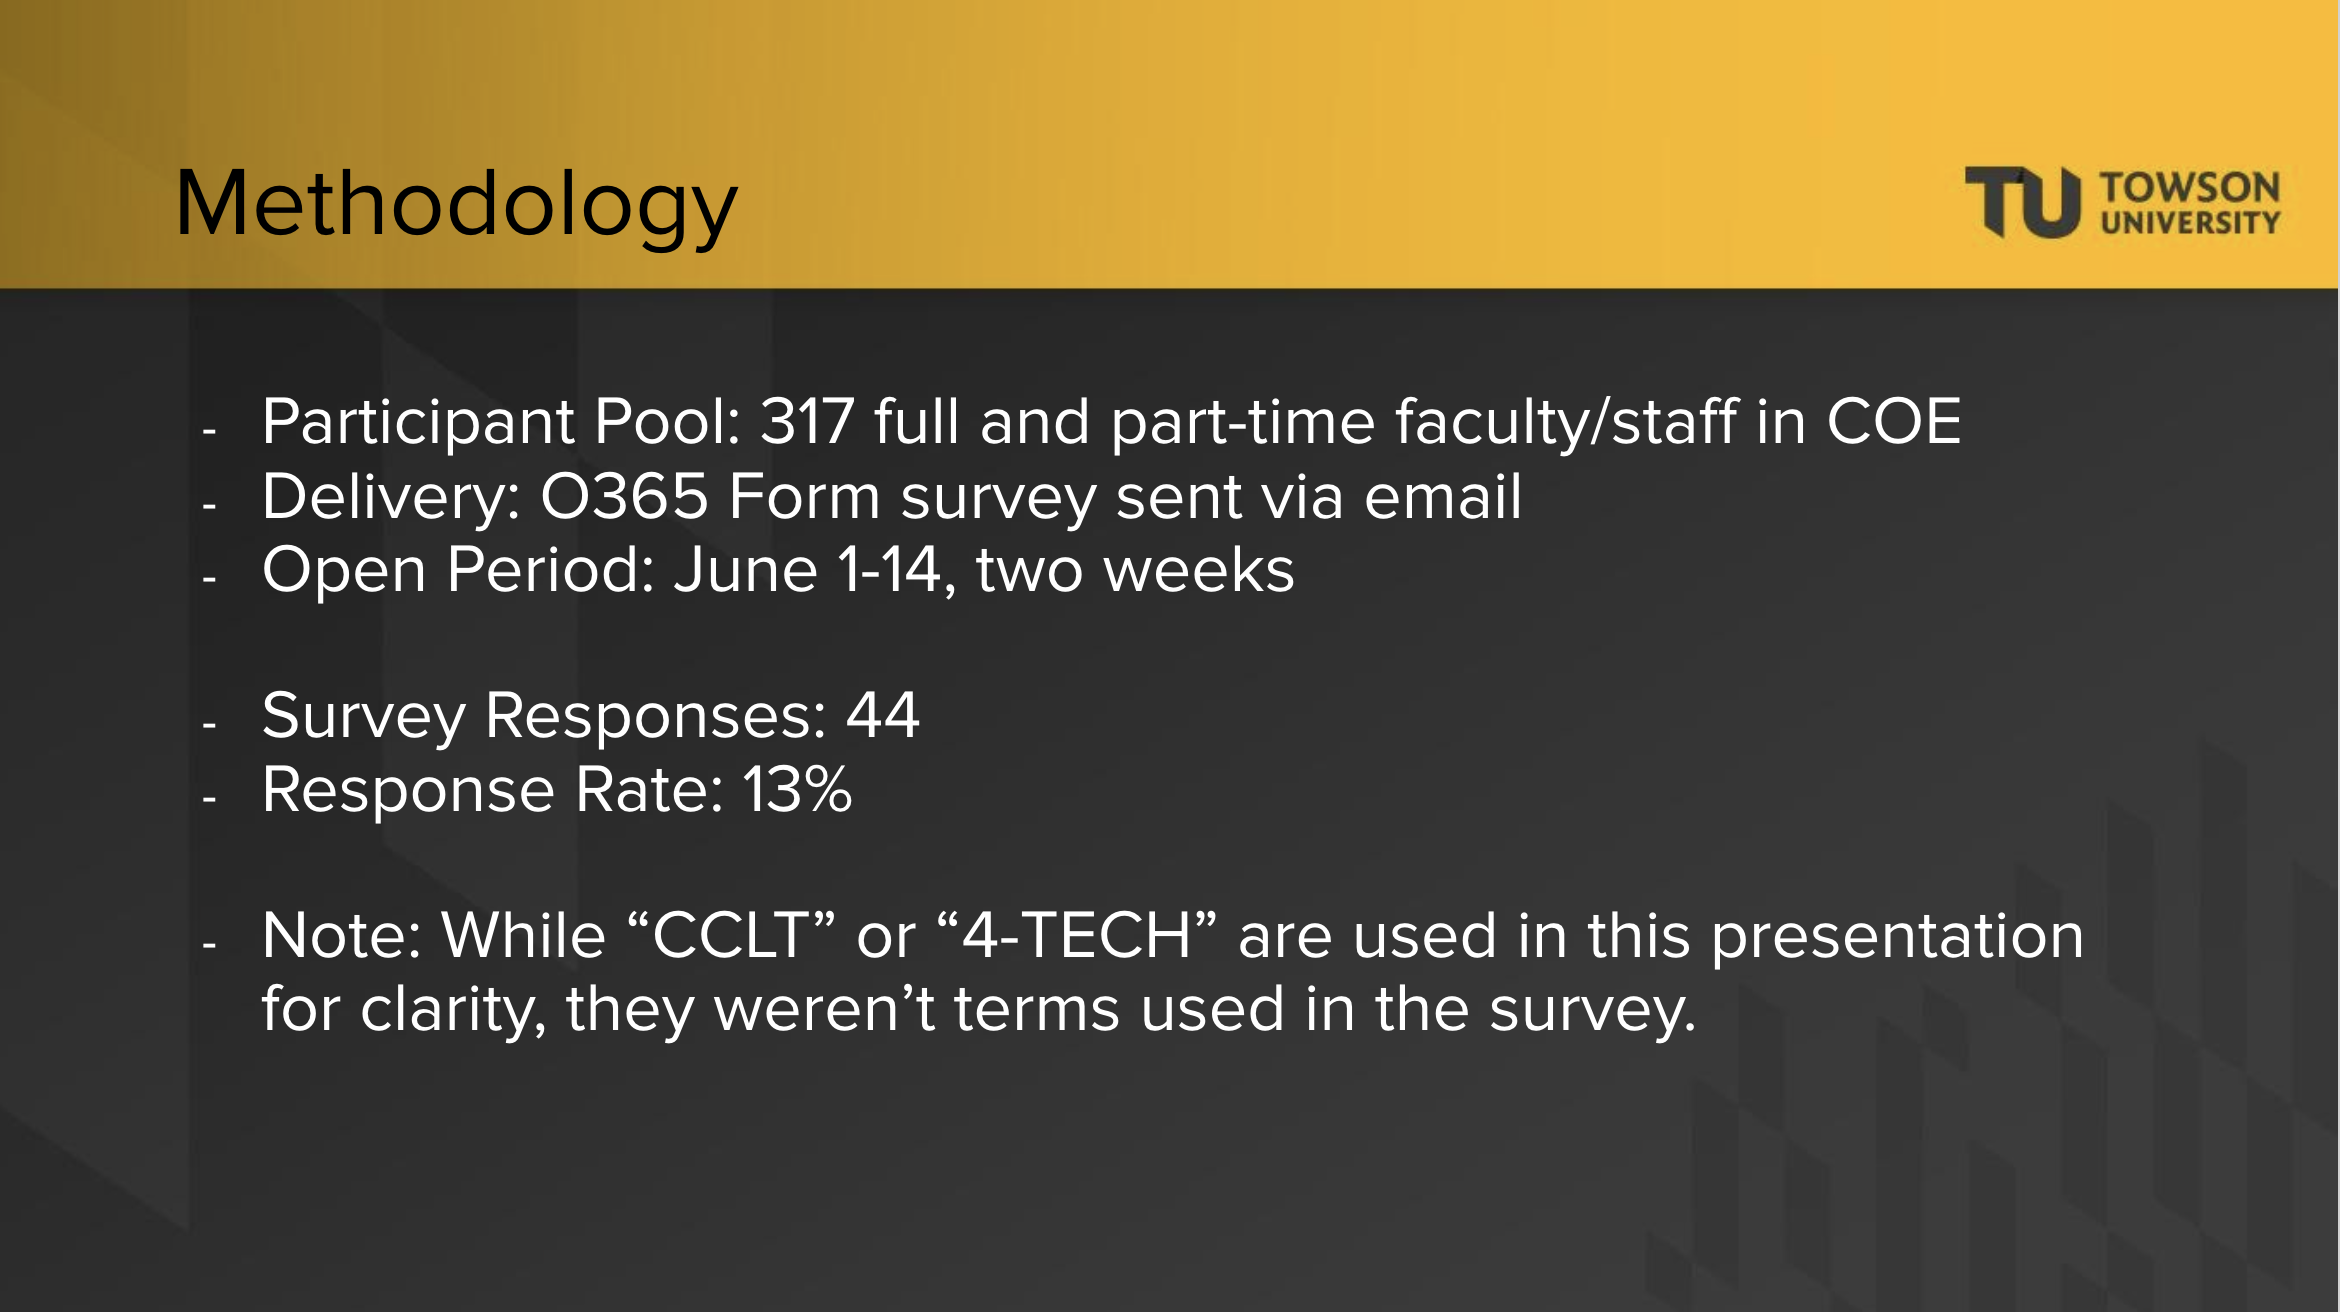
I often worked on projects requiring a pulse check from a particular group. Knowing how to survey your target audience can mean the difference between good or biased data. The first image, to the right, shows the progression of one survey from draft to the final implementation in Microsoft Forms.
The goal of this particular survey was to determine help-seeking behavior. I worked with the stakeholders of an academic division who were worried some faculty didn’t know how to get help or had confusion between the help offered by the central technology office and the division’s in-house technology assistance.
Working in a collaborative document allowed me to easily solicit feedback, refine, and finalize the survey. Once ready, I input it as a Microsoft Form to deploy. I reviewed, compiled and presented results to both the division stakeholders and to my team. This survey showed a majority preference for working with the division’s technology assistance over the university-wide IT office


Planning research: usability testing
Usability testing is a great way to find pain points in an interface. It’s also important to test proposed changes to make sure they actually make a task easier or user flow better. Being prepared for research requires a plan that includes the schedule, participant recruiting plan, and overarching questions to answer. A conversation guide is a great place to set task selection that sets up specific interactions, and makes sure sessions progress in a similar manner. It’s also important to take the research through a trial run to find any issues and ensure timing estimates are reasonable.
Presenting research: visuals
It’s important to present information in a way that is easily digestible to the audience. Visuals help tell a compelling story about the data - how it connects, why it’s important.
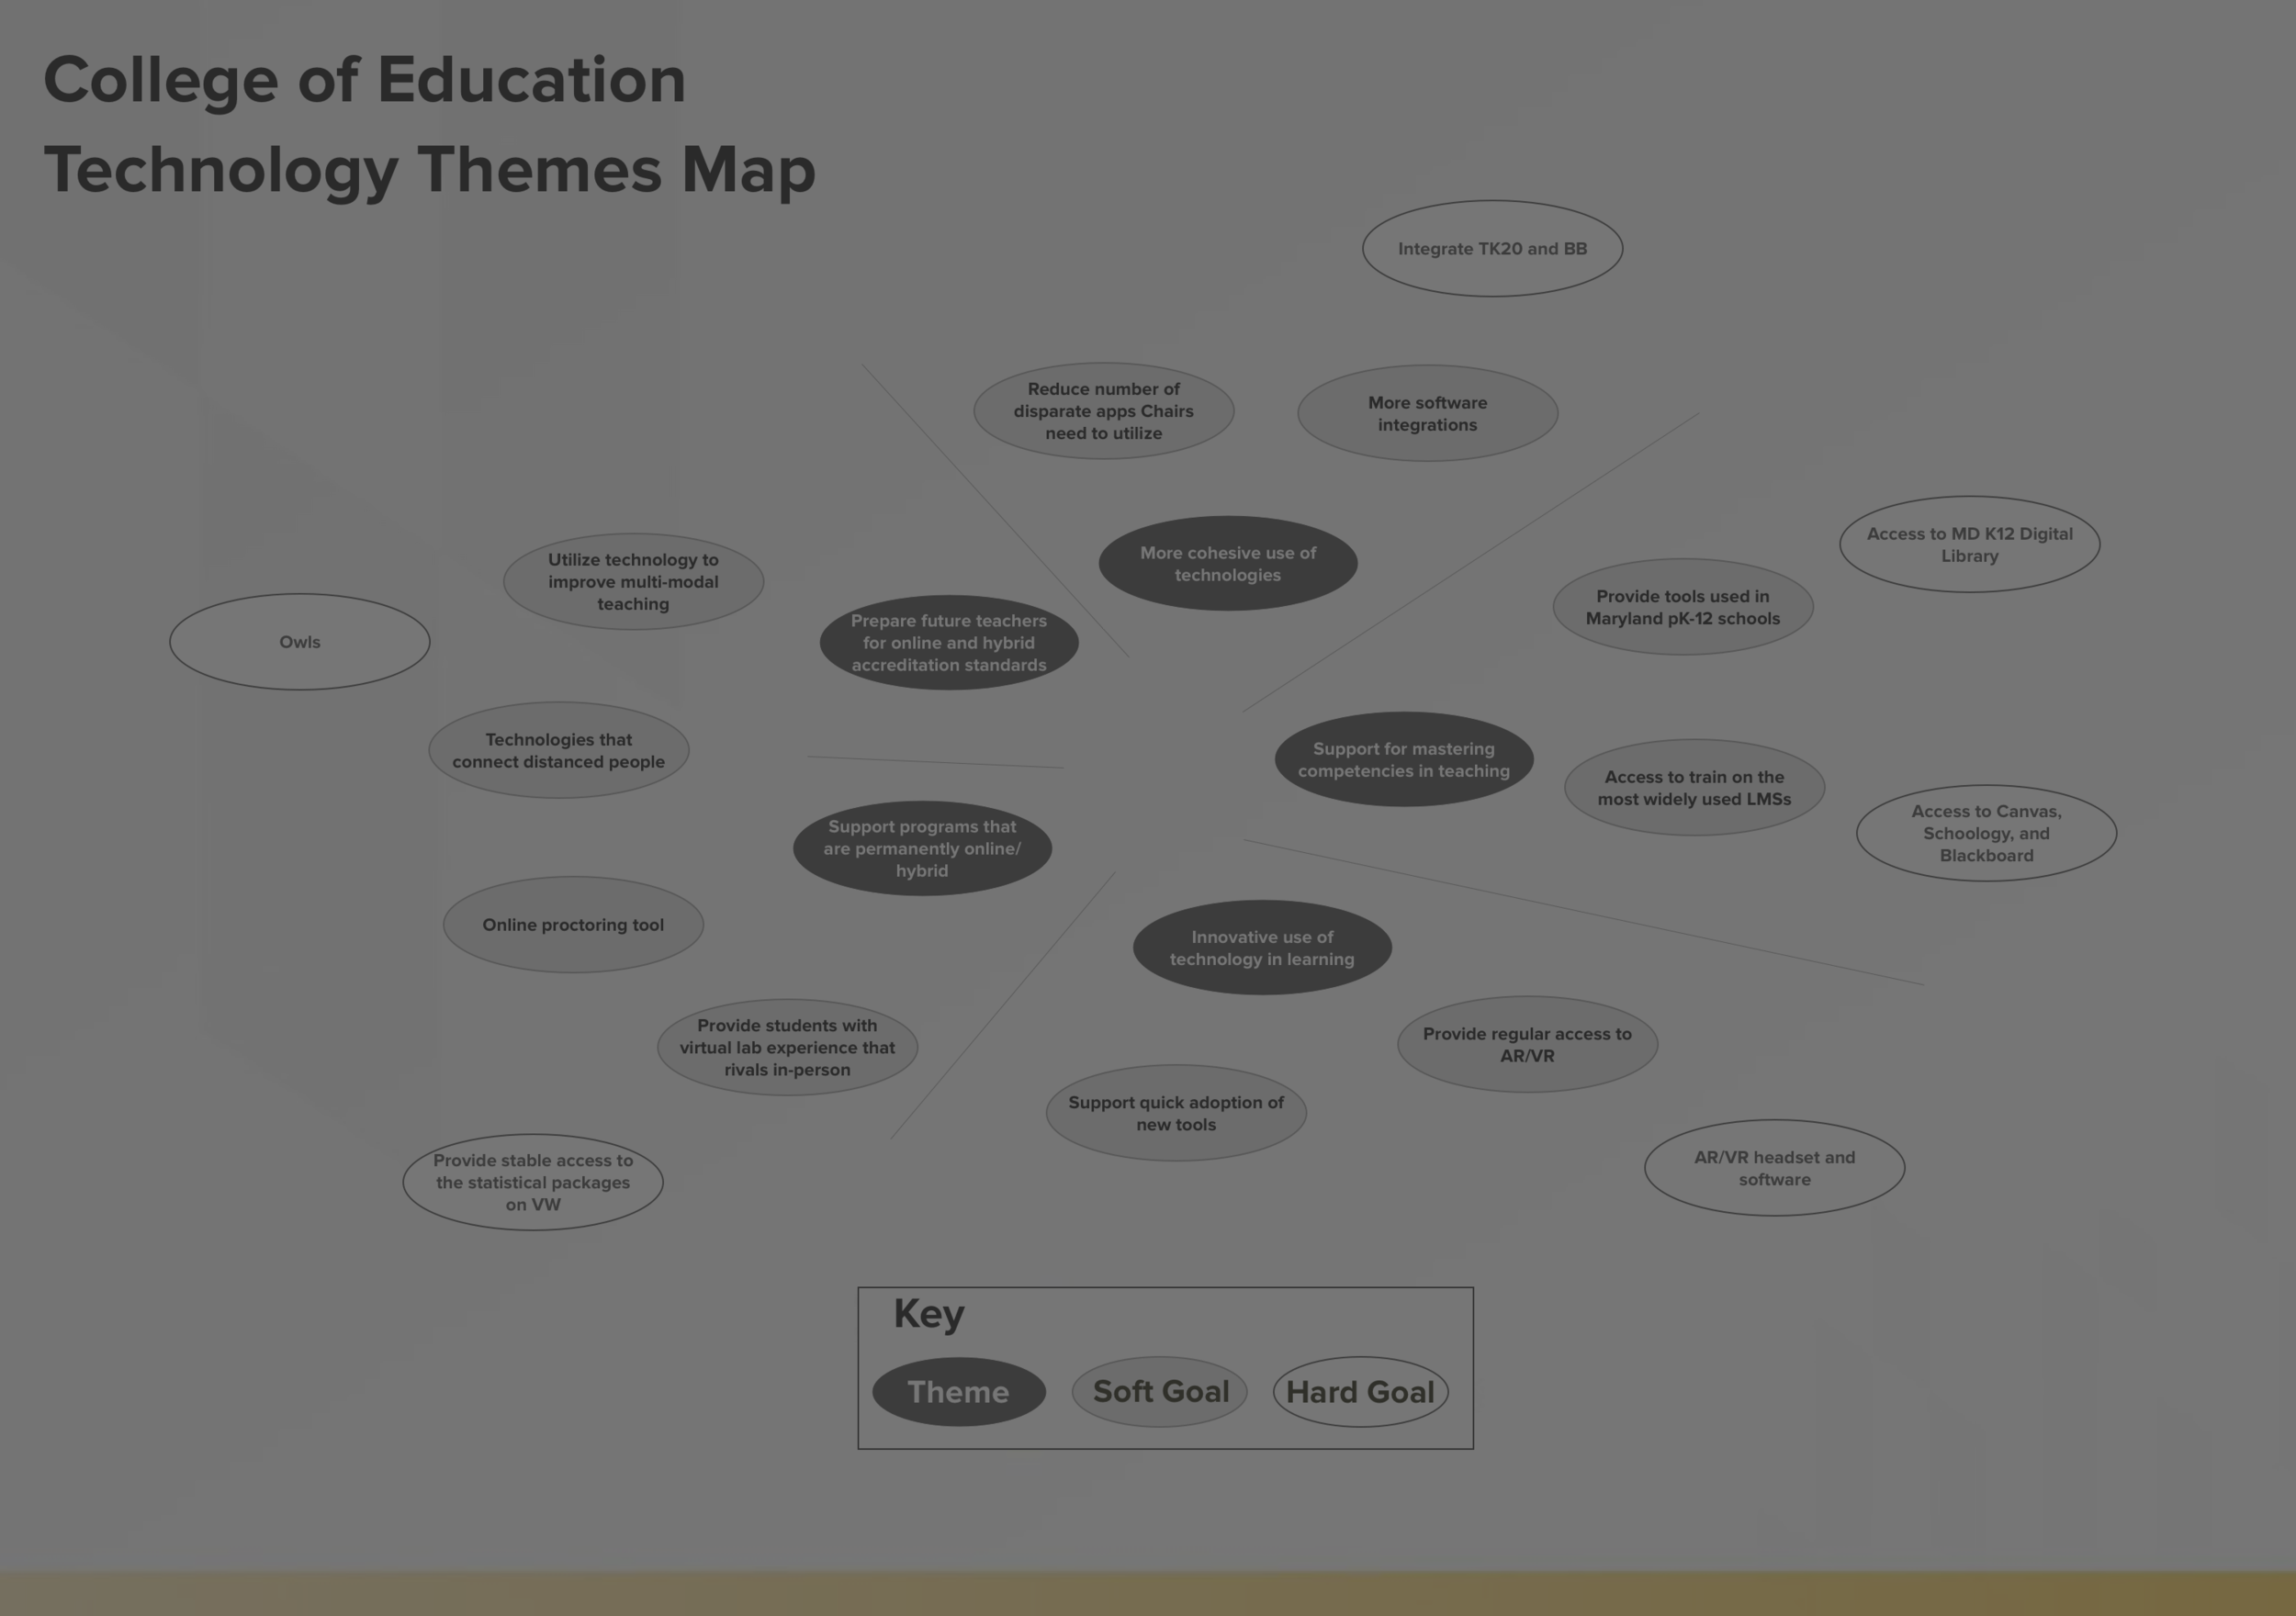
I designed the deliverable to the right based on data collected from several individual and group sessions with the objective of gaining feedback on each division’s upcoming technology needs and goals. This in turn allows the centralized technology office for the university to better understand how best to allocate technology resources and assets. This map shows the connection between broader goals of this division, at the center, and fanning out to more concrete projects or purchases they are most interested in


